Resolv
- Client
- Resolv
- Role
- Freelance Product Designer
- Timeline
- 2024–2025
- Deliverables
- Dashboard design, Modular UI library, Frontend handoff
- Total value locked
- $600M+
- Protocol launch
- Sep 2024
- Earning activities designed
- 100+
- Slippage on direct mints
- 0
Resolv is a DeFi protocol built around USR, a stablecoin that holds its dollar peg with a delta-neutral position in ETH and BTC. The market risk of that position sits in RLP, a separate token that absorbs losses in exchange for higher yield. The protocol launched in September 2024 and passed $600M in total value locked within months.
I joined as a freelance product designer while it scaled. The engagement was design work end to end: I redesigned the core dashboards, built the modular UI library underneath them, and handed both to the frontend team in a form they could ship weekly.
The product structure
USR and RLP are claims on the same collateral pool with opposite exposures. RLP takes losses first, which is what lets USR stay flat. Every screen has to keep that relationship legible, because a holder of either token is trusting the other side of it.
| USR | RLP | |
|---|---|---|
| Function | Dollar-pegged stablecoin | Insurance layer protecting the peg |
| Price | $1.00 | Floating, tracks strategy performance |
| Risk | Hedged, delta-neutral | Absorbs the pool's drawdowns |
| Yield | Stable staking yield | Higher, with leveraged exposure |
| Held by | Risk-averse users and treasuries | DeFi-native risk takers |
Dashboard design
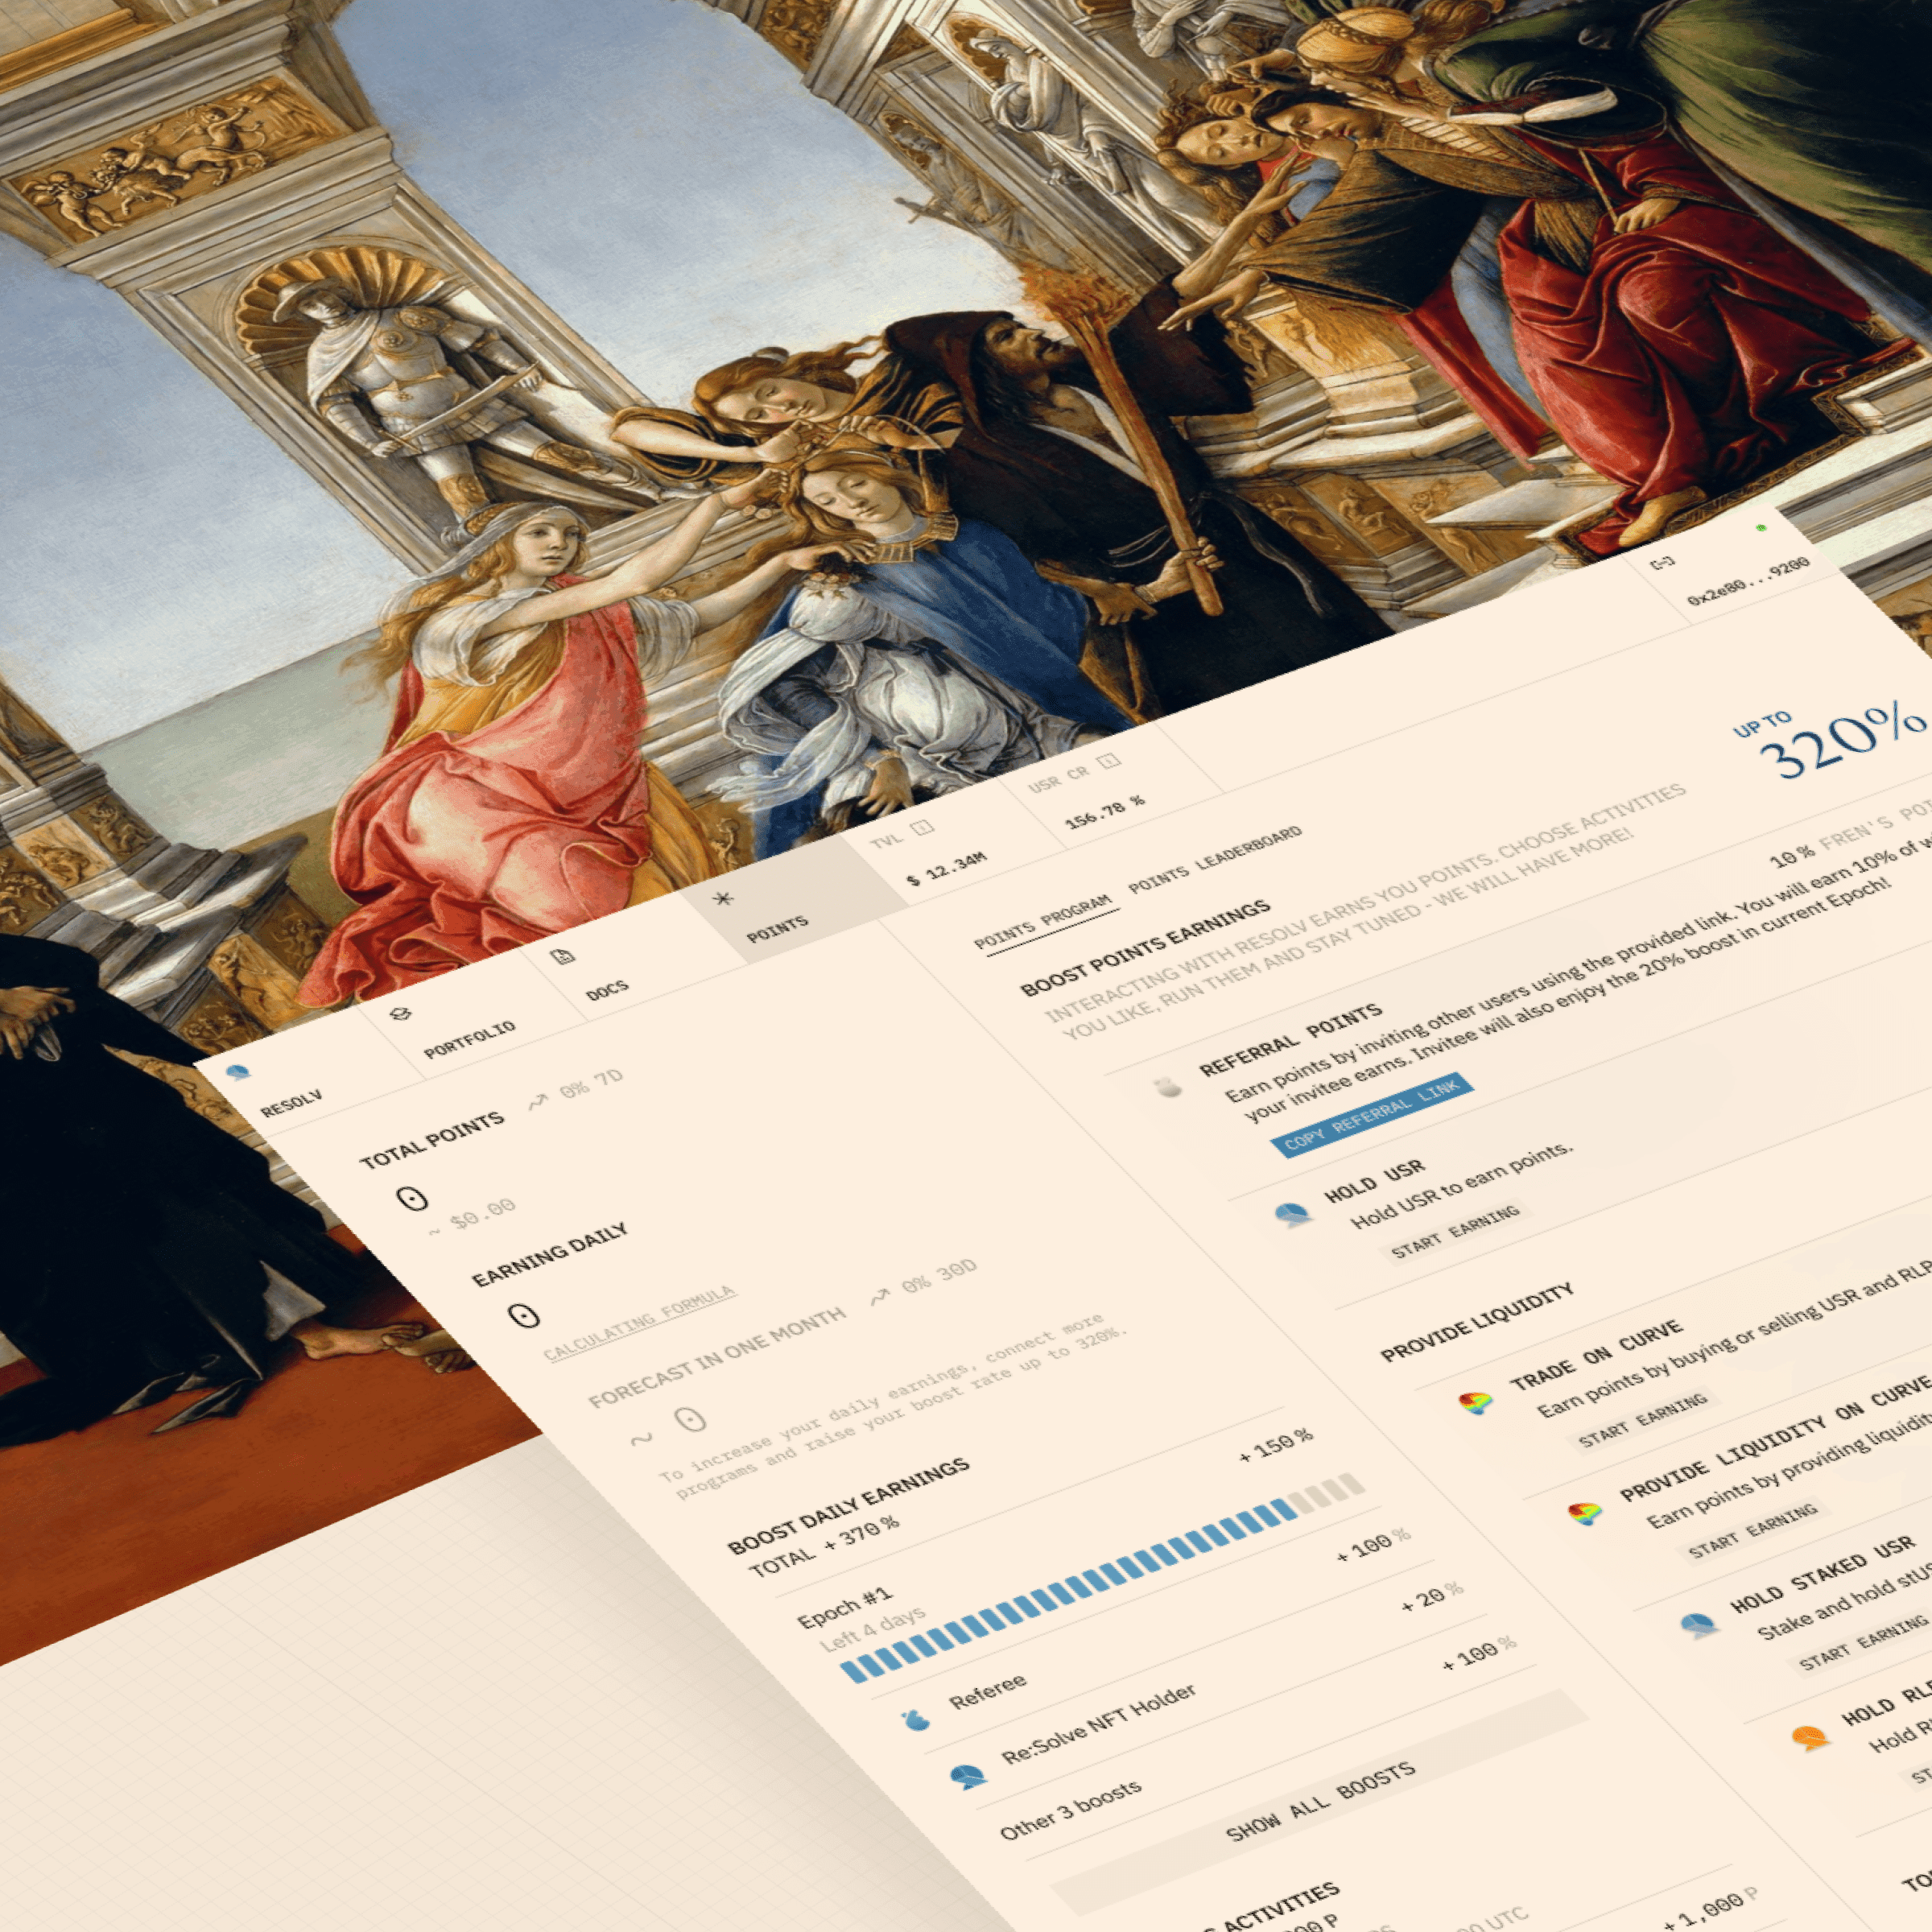
The portfolio dashboard gives each token an equal panel: price, total value locked, the composition of the backing, and yield history across 7-day, 30-day and all-time ranges. Oversized serif figures carry the numbers, and everything secondary is set small in mono. The state of the protocol is readable before a single sentence is.
Backing is the claim a stablecoin lives or dies on, so it is surfaced rather than buried. The collateral pool page breaks the pool down by venue: institutional custody, exchanges, on-chain ETH and staked ETH, each with its share. Treasury wallets are linked to Etherscan and DeBank, so composition is verifiable on-chain rather than asserted.
Risk communication continues at the point of purchase. Each token has a detail panel that rates risk, stability and earnings on plain meters, beside the contract address. A buyer sees the trade-off before the buy button.
The same layout compresses to a single column on mobile. The hierarchy holds because every screen is assembled from the same stat blocks.
Minting and swapping
Access to the tokens is tiered. Retail users trade through DEX liquidity such as Curve. Whitelisted users, KYC-verified and writing larger tickets, mint directly with the protocol at par, with no slippage. For them the swap widget quotes both routes side by side: receive amount, gas, fees and effective rate, with the better price flagged.
A DeFi transaction includes an on-chain wait the interface cannot shorten, only explain. The widget moves through explicit states, each with its own motion on the Resolv mark:
Getting approval
The protocol prepares the transaction, a hold of 10 to 15 seconds. The left half of the mark pulses.
Confirm transaction
Approval granted; the user confirms and execution begins. The pulsing stops.
Staking
The signed transaction is posted to the chain. The right half of the mark pulses.
Staked
The halves settle into a circle. Tokens arrive shortly, with a link to the transaction on Etherscan.
An error state completes the set: both halves turn red and separate. The full sequence went to engineering as an annotated board, with the motion of each state written next to it.
The design system
Resolv shipped continuously: new providers, new campaigns, new seasons of the points program. A fixed set of screens would have gone stale in a month, so I built the library in three layers with strict composition between them.
- Tier 1/primitive
The raw marks. No layout opinions, no product context.
- label / value
- meter
- flag
A caption, a figure and a rule between them. Most of the interface is this row, repeated.
Composition bars and rating scales, reused from the collateral pool page down to the token panels.
Small status markers, such as the best-price flag on a quote.
- Tier 2/part
Primitives composed into a unit with one job.
- provider card
- stat block
- activity card
One route quote: receive amount, gas, fees, effective rate. Every swap provider is an instance of this card.
A headline figure, its composition bar and its chart. The dashboard is four of these.
One earning activity: rate, cadence, action. The points program is a grid of these.
- Tier 3/application
Parts assembled into a shipped surface.
- portfolio dashboard
- swap widget
- points program
The structure earned its keep when routing changed. Retail swaps later consolidated behind a single aggregator, so the side-by-side comparison retired. Because every provider was an instance of the same card, the interface simplified by deleting instances. Nothing was redesigned.
Handoff went beyond redlines. Components shipped with their behavior
specified: skeleton states for loading, debounced polling for live quotes, and
quote expiry after 15 to 30 seconds so a stale price can never be executed.
Where code was faster than a spec, I delivered code; the referral celebration
ran in production on a prototype I built with js-confetti.
Scaling the points program
Season 3 of the points program allocated 3% of total supply to incentives. The activity list grew from roughly ten entries to more than a hundred as integrations landed: Curve, Pendle, Spectra, Euler, Morpho, Uniswap, Aerodrome and others.
Earning activities in the points program data table
| Label | Value |
|---|---|
| At launch | 10 |
| Season 3 | 100 |
The design problem became findability rather than presentation. I added filtering by chain, activity type and earning category, so a yield trader on Arbitrum and a passive USR holder each see the short list that applies to them.
Outcome
For a protocol asking people to park nine figures of capital, the interface is part of the risk assessment. Clear dashboards, verifiable backing and predictable transactions were design's share of that trust.