RobinFood
- Client
- RobinFood (now RegenOS)
- Role
- Founding Product Designer
- Timeline
- 2024–2026
- Deliverables
- Field research, Marketplace data model, Frontend, built with AI, Design-to-deployment pipeline
- Dutch regenerative farms, contracted
- 12
- Dutch production companies, onboarded
- 4
RobinFood was a marketplace for the produce Dutch farms could grow but not sell: good crops rejected on appearance, with no way to price them below "perfect." It let farms sell by grade, with sorting and cutting as services, to production companies that could not otherwise use them.
I was the founding product designer on a four-person team of founder, data scientist, engineer, and me. I owned research, product strategy, and the frontend, which I designed and built with AI. The company later became RegenOS, and I worked through that pivot too; the screens here are all RobinFood-era.
The subject is also personal: my grandfather, Alfred Brugger, led Switzerland's wheat and grain department and later became its minister of agriculture. Two generations on, this was my version of the same work — the trade of agricultural commodities, pointed at food waste.
The problem
I spent discovery in dozens of interviews with Dutch growers and production companies, and structured what they told me into a jobs-to-be-done corpus: 120 job statements across seven roles, built as data so AI could keep working with it through design. Underneath everything sat one finding:
The farmers put a number on it:
Middlemen are sorting and grading my produce, and 20% gets wasted. I lose 20% of the capital I could have earned.
The buyer had the same problem, upside down:
Working with Grade B and C produce is impossible, because I don't have the standardized machinery to deal with this process.
The farmer cannot sell it; the manufacturer cannot use it. The sorting and cutting had to happen somewhere, and nobody owned it. That became what the marketplace sold:
The solution
Everything from here on is work I led: the strategy, the data model built with the data scientist, the flows, the screens, and the frontend code.
Six operations, one carrot
Before designing anything I mapped the whole chain and named six products we could build on it:
| Operation | The product | Called |
|---|---|---|
| RegenOS | Farm production management: yield forecasting, sensors, field insight | Later |
| RobinFood | Buy and request commodities, on spot or on contract | Near term |
| Food Trust | Traceability, from field to the shelf it sold on | Near term |
| Juggernaut | The manufacturer's own inputs and outputs | Later |
| Labrattatouile | Design and dispatch recipes with production companies | Parked |
| Pitchfork | A bridge from the production chain to consumers | Parked |
Then the positioning. I plotted the tools these companies already used on two axes and asked the founders to place us:
Chart data table
| Product | Flexible | Collaborative | Quadrant |
|---|---|---|---|
| Classic ERP | 0.12 | 0.16 | Out of the box / Structured |
| Food-specific ERP | 0.30 | 0.10 | Out of the box / Structured |
| Modular / low-code | 0.85 | 0.22 | Out of the box / Flexible |
| Supplier portals | 0.18 | 0.72 | Collaborative / Structured |
| Traceability networks | 0.30 | 0.86 | Collaborative / Structured |
| RobinFood | 0.72 | 0.74 | Collaborative / Flexible |
The model underneath
I built the data model with the data scientist, starting from a real grower's planning spreadsheet. It had a tell: columns for waste volume, almost always empty. Waste was not sellable, so nobody wrote it down.
The model resolved into seven domains:
| Domain | What it holds |
|---|---|
| User | Who is acting, and on whose behalf |
| Company | The farm or production company |
| Geospatial | Parcels, blocks and beds |
| Organizational | How those parcels are grouped and worked |
| Biological & ecological | Soil type, condition, what the ground can support |
| Temporal | Crop cycles: previous year, this year, next year |
| Transactional | Listings, requests, offers, orders, invoices |
Requests and listings are both batches, matched many-to-many: a 500 kg request is filled by several farms, which is why the buyer's dashboard leads with percentage fulfilled rather than an order status. None of this is hypothetical. It is visible in the pilot farm's real season plan:
| 295 t of carrots, one parcel | National wholesaler | Box-scheme retailer | Via RobinFood |
|---|---|---|---|
| Volume | 100 t | 10–15 t | 185–195 t |
| Price per kg | €0.69 | €0.85 | Open |
| Services | None | Washing, storage, processing | Via the platform |
Grade, specification, service
Grade is a first-class primitive and carries a price. The same crop lists as Grade A at €0.65 a kilo, Grade B at €0.45, Grade C at €0.35. Imperfect produce becomes a line item with a buyer.
Specifications sit beside grades: a Grade 3 carrot at 50–60mm is a different product from one at any size, and the request can say so.
Following one lot through the chain showed why services had to be their own thing:
- 011000 kg carrotHarvested. Uncut, unwashed. One farm, one crop cycle.
- 02Washing serviceA third party, at their facility, at their price.
- 03Cutting serviceA second third party. Same lot, a second cost.
- 04500 kg → buyer ACut and washed, because that is what they specified and paid the services on.
- 05500 kg → buyer BThe lot splits here. Same crop, same farm, none of the work, a different price.
So services became conditions on the trade: requirements a buyer sets that must be met before a supplier is allocated into the chain. The work itself is done by third-party providers who get paid for it, so it costs extra and shows up in the contract. The production company will buy Grade B once it has been through a cutter.
Spot or request
There were two credible ways for a buyer to get produce, and for a while we designed both:
Flow 1: browse the spot market
Search a commodity, filter, add to cart, check out. A shop: it works the instant there is stock on the shelf, and not one minute earlier.
Flow 2: post a request
State commodity, volume, target price, grade, services and date. Farms answer with offers; you compare and accept. Works with an empty warehouse.
We went request-led. A purchase order starts from a demand-side need; nobody browses for carrots. Matching was a human trader at first, on purpose: every manual match was training data for the automation that would replace them.
The supply chain as a graph
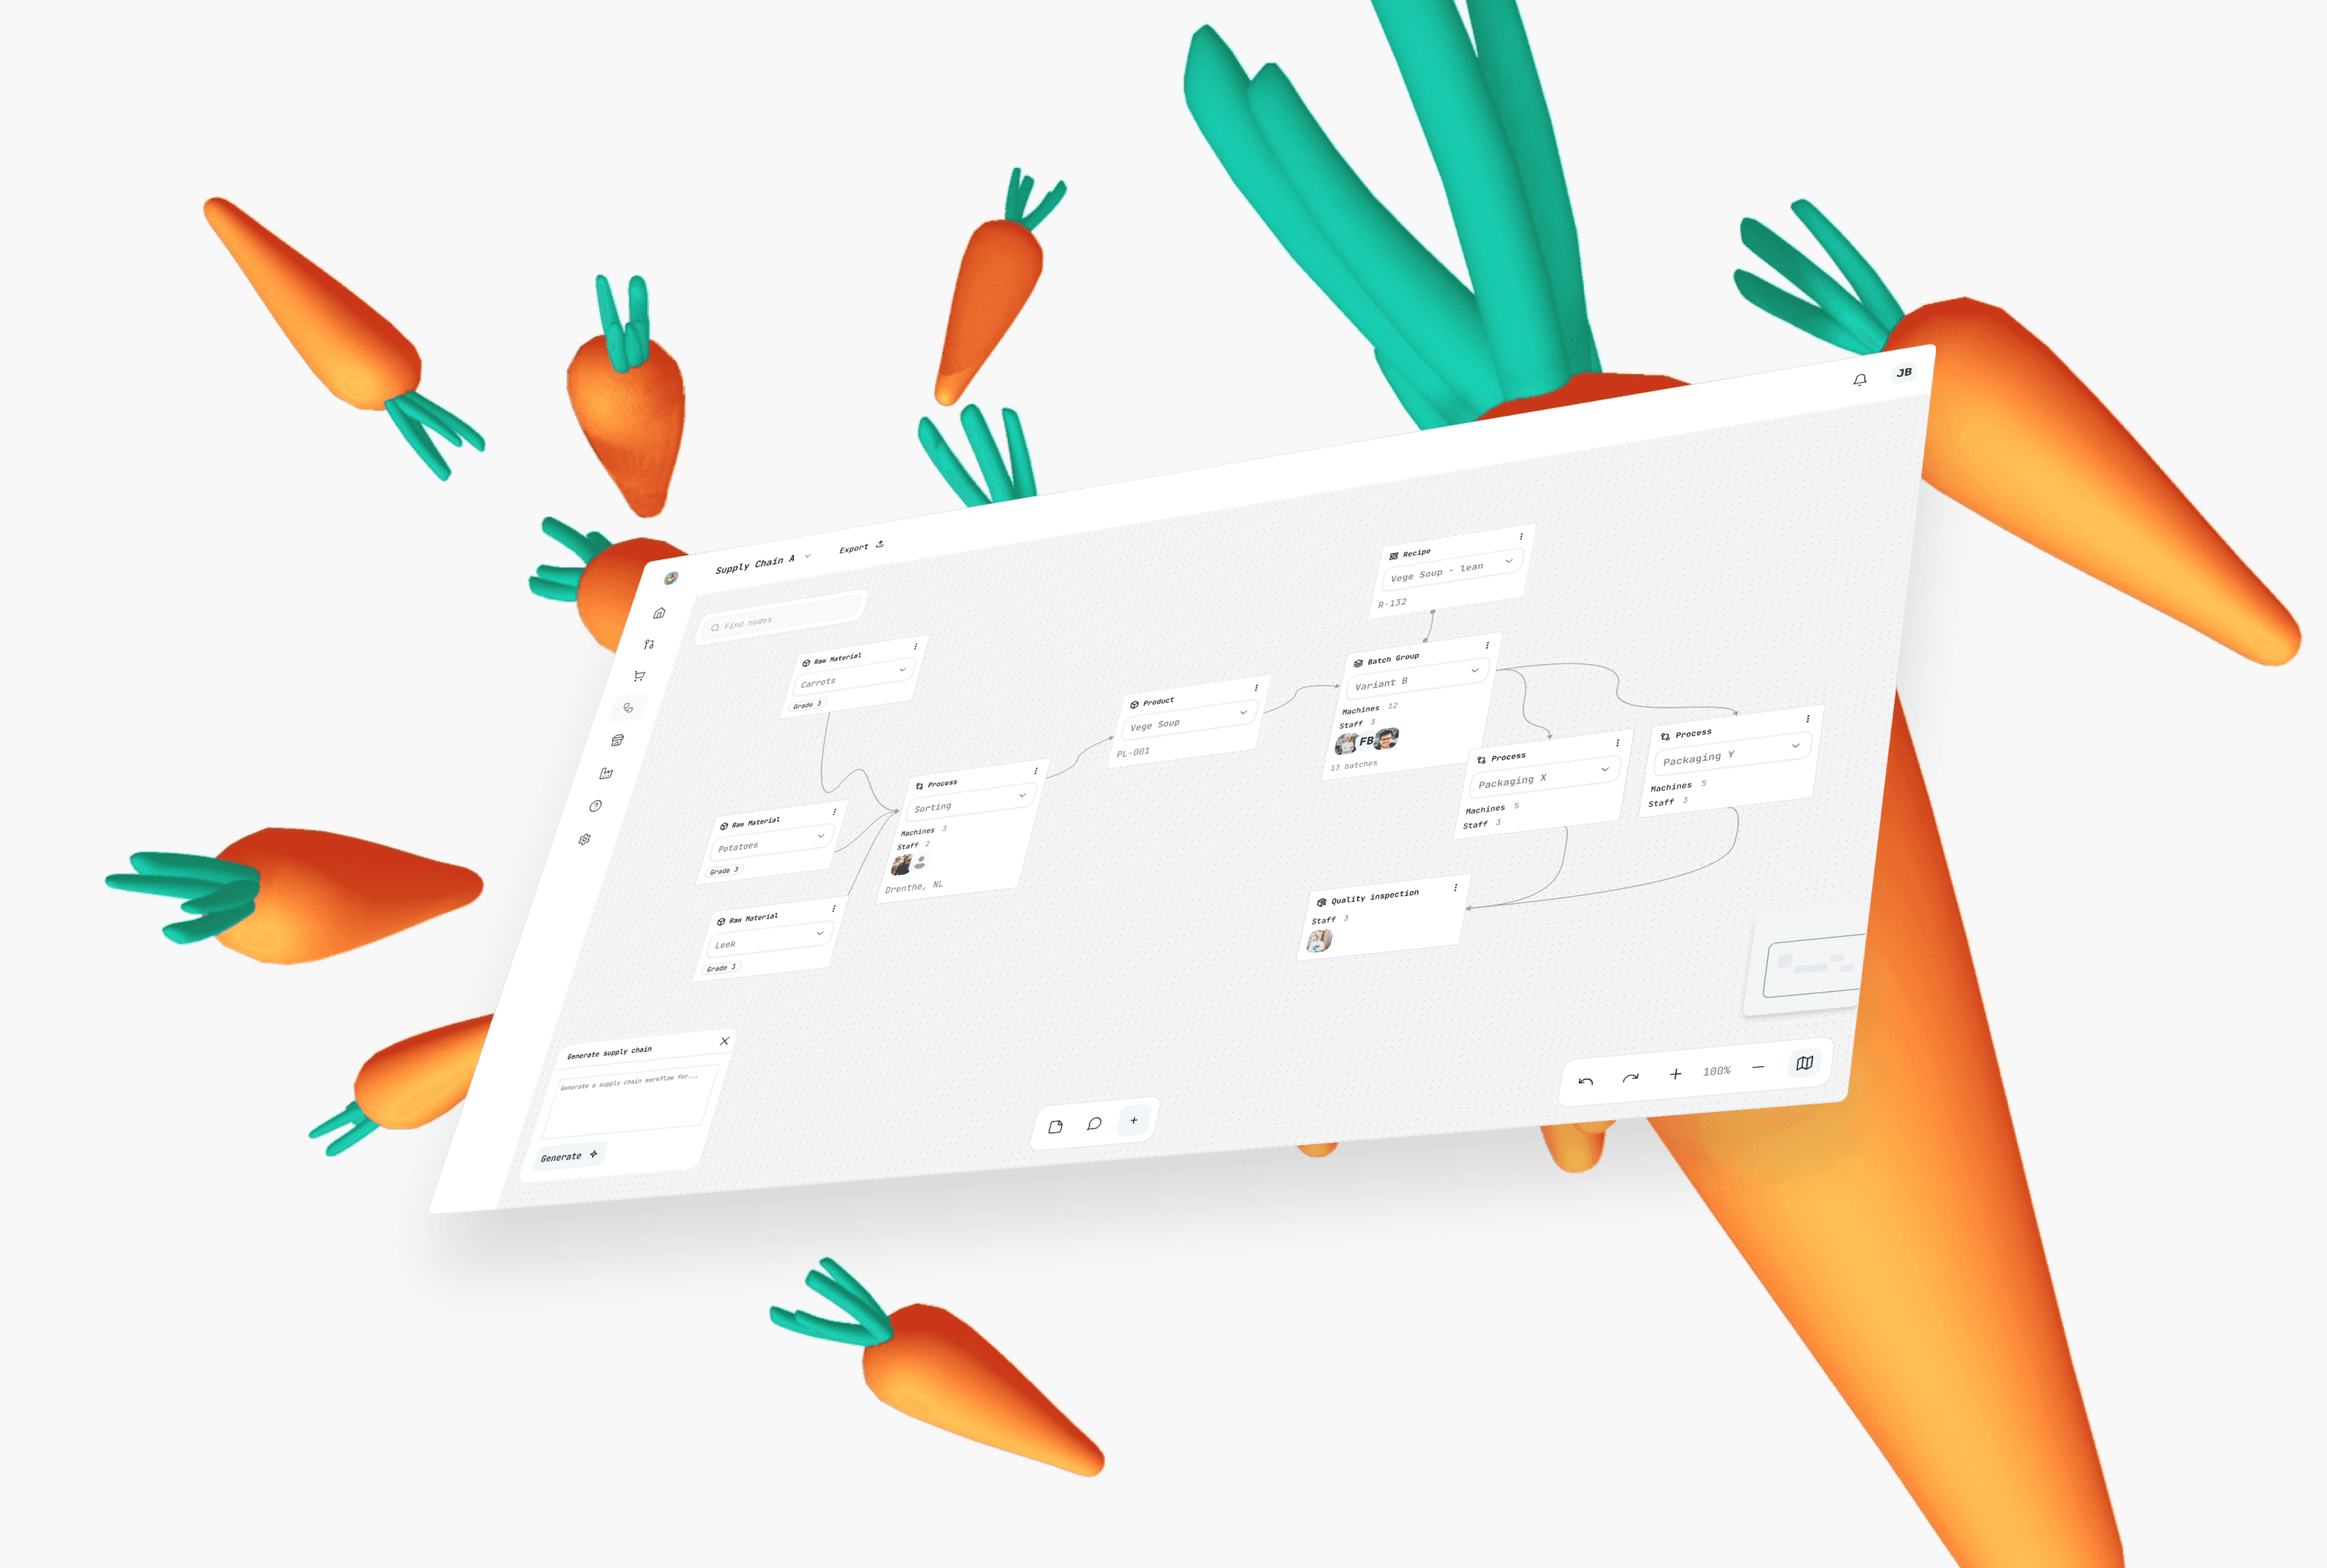
After the trade, production companies describe what happens to the crop. The industry stores that as a table; we drew it as a graph, because the graph is what the auditor requires:
Help me be prepared when the auditor arrives, so I can stress less and focus on running my business.
Built in that shape, the compliance document becomes a byproduct of setup instead of a week of redrawing each year. Every branch is another sellable output (the team called it valorization), and AI drafts the first version from a plain-language description.
Two users, two complexity budgets
The same system serves a farmer checking prices between jobs and a production planner living in it all day, so the two sides got deliberately unequal interfaces.
The farmer product has five core modules: revenue, orders, crops, help and settings. Incoming requests are the heart of it.
The production product has twelve modules, because four jobs share one account: buying, running the lines, meeting the auditor, chasing the invoice. The split came from the jobs-to-be-done corpus. Density is a feature here and a failure two screens earlier.
The design-to-code pipeline
I designed and built the frontend with AI, and in February 2026 wrote it up as an architecture proposal: design velocity was capped by frontend engineering capacity, and hiring for it would have spent the runway.
Research
Establish the technical patterns and constraints before design starts.
Figma: flows and IA only
No pixel-perfect screens; production fidelity gets decided in the component library.
Component library in React + Tailwind
The design system as real code, maintained by designers, consumed by engineers.
AI as pair programmer
Claude Code wires components to state and API contracts while the designer stays in product thinking.
Sandbox
Working software in front of stakeholders instead of static mockups.
GitHub as the boundary
Pull requests, not handoffs. Engineers review and merge.
The core argument: consistency is enforced through code, not documentation. Change a component and every screen changes; break its API and the type errors say where.
The impact
RegenOS moved the product a layer down, from trading the harvest to an operating system for the farm, built on the second research finding: no insight. I stayed on to design it.
My brief was a translation job. The data scientist's dashboard fused satellite indexes, radar and weather; it was correct, and almost unreadable. I rewrote it as problem–solution fit, in the farmer's sentences:
| What the farmer says | What they get |
|---|---|
| “I don't know which fields to check first.” | Fields coloured against their own historical normal: a priority list for this morning |
| “Is this field really behind, or just late?” | This year's curve against the historical spread for that day of year |
| “Is it the weather or something else?” | Rainfall and temperature plotted under the growth curve |
| “I only see problems when it's too late.” | Season playback, plus a threshold they set themselves |
One control matters most: the farmer sets the alarm threshold. A system that flags every deviation trains its users to ignore it. The dashboard shows what is happening and stops there; it supports the decision, the farmer keeps it.
Learnings
One idea never shipped: an emissions subsidy, minted by a platform treasury and applied at the moment of purchase.
| Per 100 barrels | Imported wheat | Local wheat |
|---|---|---|
| Listed price | $100.00 | $110.00 |
| Subsidy, minted by the treasury | −$5.00 | −$16.50 |
| What the buyer pays | $95.00 | $93.50 |
| What the farm receives | $100.00 | $110.00 |
It was cut, rightly: it needed a token economy before the marketplace had a single completed transaction. What I keep from it, and from the whole arc:
Learning
Value lives in the transaction, not the marketing
Grade as a column, service as a priced condition, emissions as a price: three attempts at one idea. A sustainability product becomes real in its data model or stays a poster.
Learning
Manual first, then automate
The human trader was not a compromise: every match they made was ground truth for the algorithm that would replace them. Launching with the algorithm would have been guessing.
Learning
Know why the prototype worked
The no-code tool's one-table limit leaked into the first schema. Knowing which parts of a model come from the domain and which from the tool is most of the work of throwing a prototype away properly.